
The microjet of RW Aur A, a classical T Tauri star in Taurus-Auriga star forming region, is studied from the point of view of X-wind models. The archived Hubble Space Telescope / STIS spectra of the optical forbidden lines [O I], [S II], and [N II] from RW Aur A, taken in Cycle 8 with seven parallel slits along the jet axis, spaced at 0″.07 apart, were analyzed. Images, position–velocity diagrams, and line ratios among the species were constructed, and compared with synthetic observations generated by selected solutions of the X-wind. Prominent features arising in a steady-state X-wind could be identified within the convolved images and position–velocity diagrams, including FWHM and high-velocity peaks on both of the redshifted and blueshifted jets. The well-known asymmetric velocity profiles of the opposite jets were built into the selected models. We discuss model selections within the existing uncertainties of the stellar parameters and inclination angle of the system. In this framework, the mass-loss rates that were inferred to be decreasing along the jet axis in the literature are the results of slowly decreasing excitation conditions and electron density profiles. Despite the apparent asymmetry in the terminal velocities, line intensities and mass-loss rates, the average linear momenta from the opposite sides of the jet are actually balanced. These previously hard-to-explain features of the asymmetric RW Aur A jet system can now be interpreted in a different but self-consistent manner within the X-wind framework.
Asymmetries revealed by high-resolution HST/STIS spectroscopy
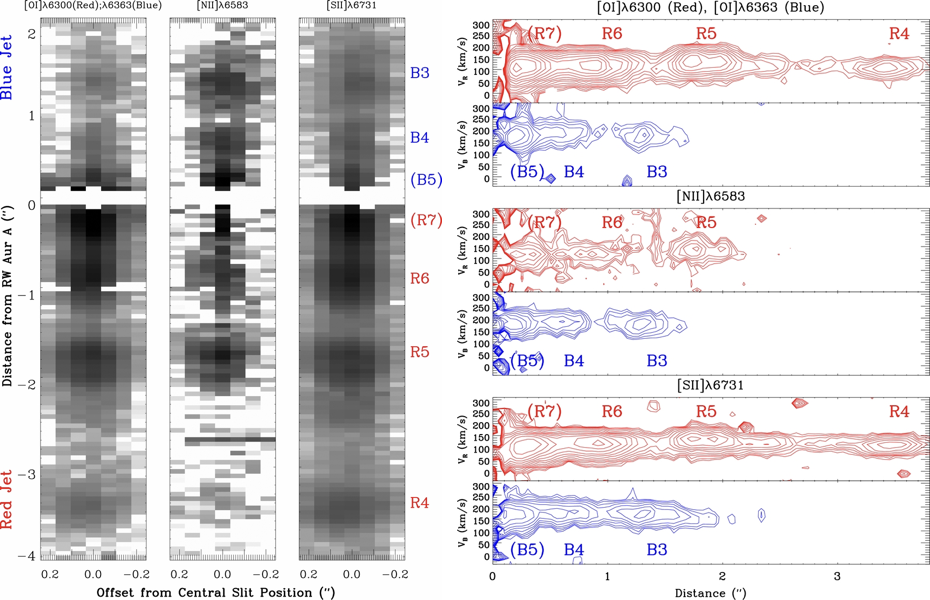
RW Aur observed by HST/STIS in forbidden emission lines ([O I], [N II], and [S II]) at red wavelengths. Emission-line maps are shown in the left panel and position–velocity diagrams in the right panel. The asymmetries between the blue- and red-shifted lobes in brightness can be shown in the maps and those in kinematics can be shown in the position–velocity diagrams.
X-wind solutions based on observed constraints of RW Aur
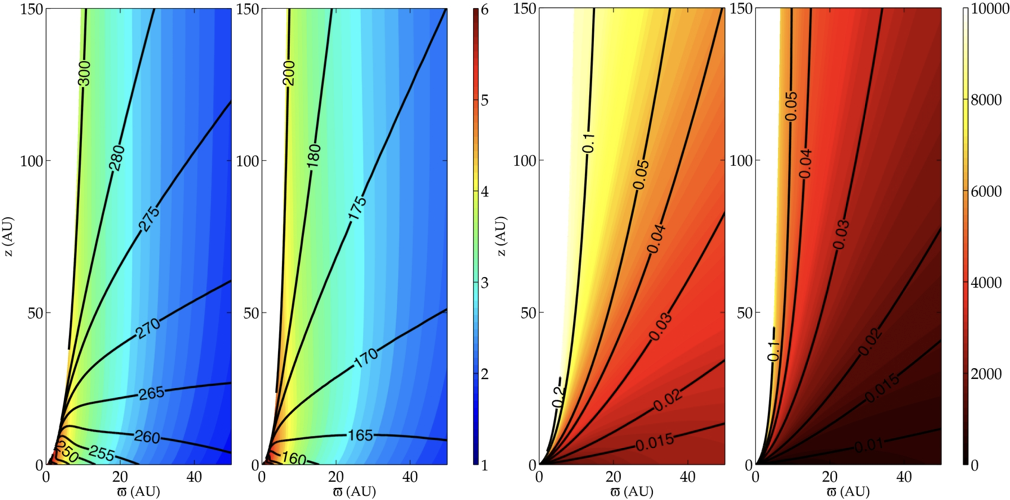
Left: electron number density in color and poloidal velocity in black contours. Right: temperature in color and electron fraction in black contours. In each panel, the left and right figures are fitting to the blue- and red-shifted lobes, respectively. The X-wind solutions for the two lobes have different mass loading and these physical properties are self-consistently solved by matching the velocity and brightness asymmetries observed in the jets.
Comparisons between HST/STIS observed spectra and X-wind synthetic spectra
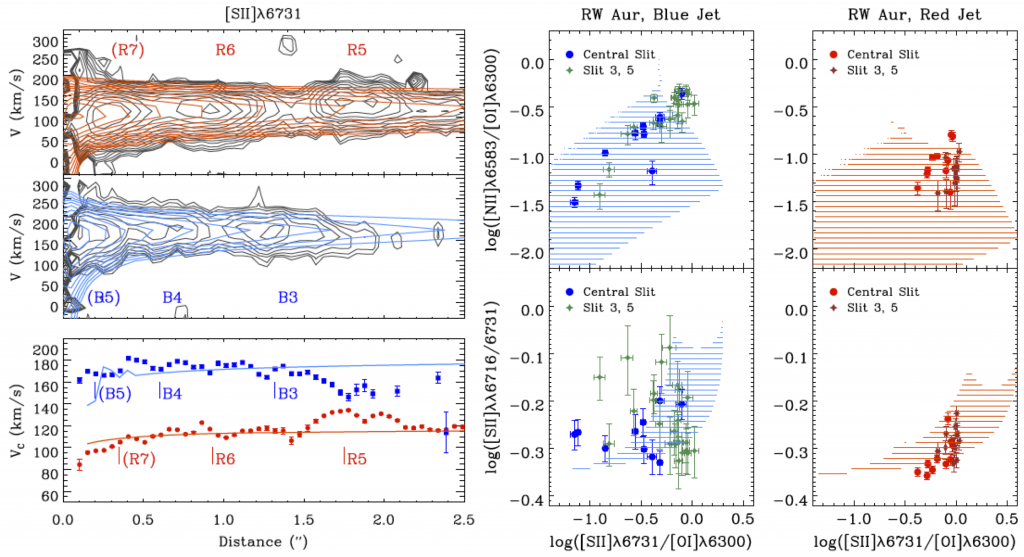
Left: optical [S II] line position–velocity diagrams of the blueshifted and redshifted microjets from observed (black contours) and synthetic (red and blue contours) spectra, and their velocity centroids (observed values in discrete symbols and modeled values in solid lines). The X-wind model solutions are obtained individually from the two sides of the jet constrained by their radial velocities and line intensities.
Right: optical line-ratio diagnostic plots from [O I], [N II], and [S II] lines. The observed values are in discrete symbols and the synthetic values are in color shades. The loci from the blueshifted and redshifted microjets do not overlap on the plots, suggestive of different physical conditions in the jet.
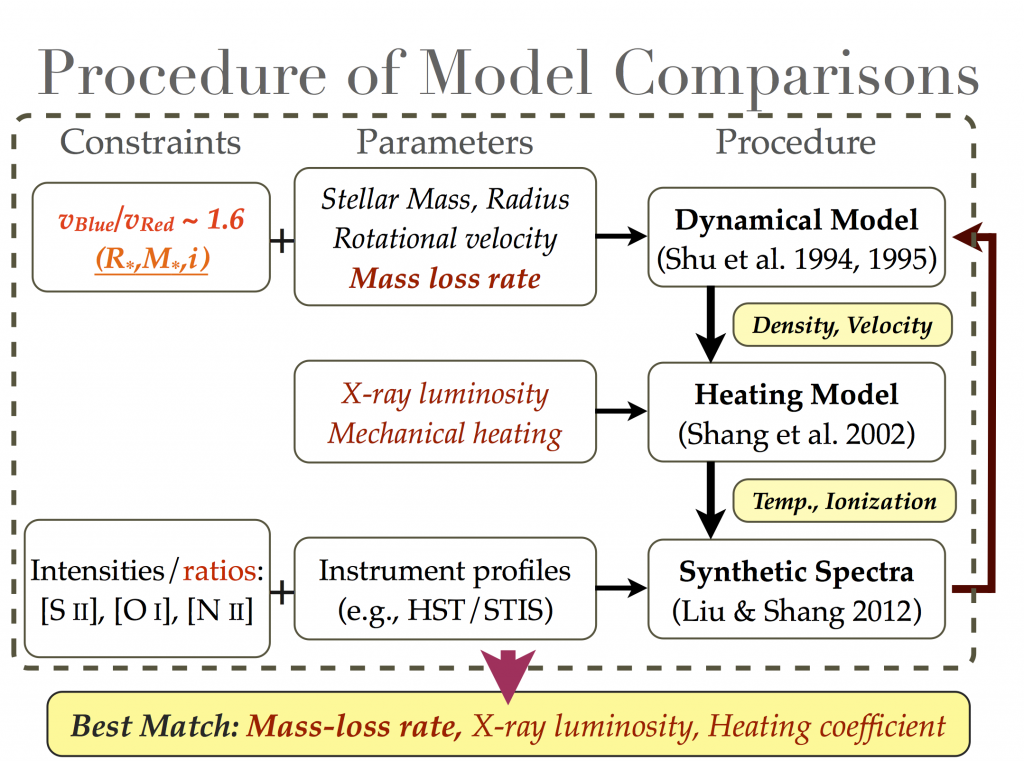
Schematic view of model comparisons based on X-wind solutions and observational constraints
Related Publications
- Liu C-F; Shang H, “RW Aur A from the X-Wind Point of View: General Features”, ApJ: 761(2), 94, Dec 20, 2012 [SCI] ( ADS | Fulltext )
- Shang H; Glassgold AE; Lin W-C; Liu C-F, “Ne II Fine-structure Line Emission from the Outflows of Young Stellar Objects”, ApJ: 714(2), 1733-1739, May, 2010 [SCI] ( ADS | Fulltext )
- Shang H; Glassgold AE; Shu FS; Lizano S, “Heating and Ionization of X-Winds”, ApJ: 564(2), 853-876, Jan, 2002 [SCI] ( ADS | Fulltext )