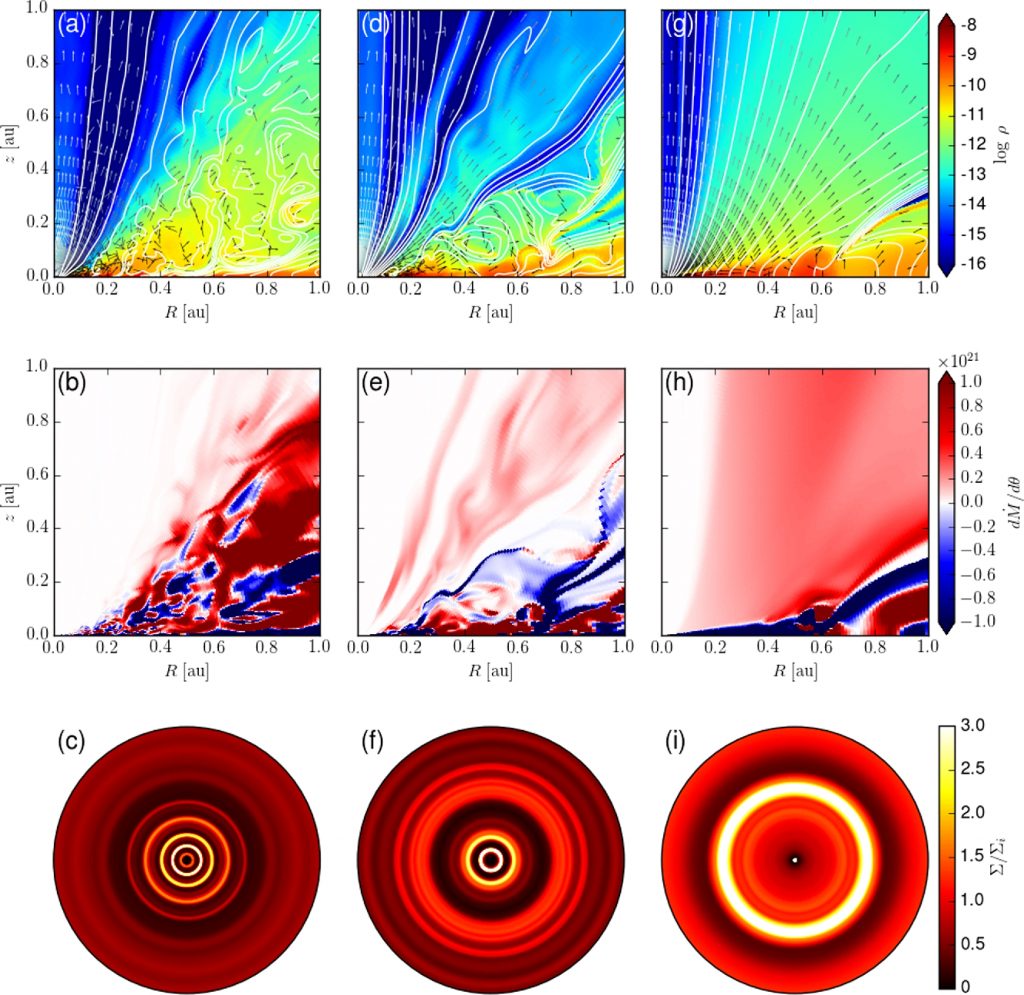
Rings and gaps are being observed in an increasing number of discs around young stellar objects. We illustrate the formation of such radial structures through idealized, 2D (axisymmetric) resistive magnetohydrodynamic simulations of coupled disc-wind systems threaded by a relatively weak poloidal magnetic field (plasma-β ∼ 103). We find two distinct modes of accretion depending on the resistivity and field strength. A small resistivity or high field strength promotes the development of rapidly infalling ‘avalanche accretion streams’ in a vertically extended disc envelope that dominates the dynamics of the system, especially the mass accretion. The streams are suppressed in simulations with larger resistivities or lower field strengths, where most of the accretion instead occurs through a laminar disc. In these simulations, the disc accretion is driven mainly by a slow wind that is typically accelerated by the pressure gradient from a predominantly toroidal magnetic field. Both wind-dominated and stream-dominated modes of accretion create prominent features in the surface density distribution of the disc, including rings and gaps, with a strong spatial variation of the magnetic flux relative to the mass. Regions with low mass-to-flux ratios accrete quickly, leading to the development of gaps, whereas regions with higher mass-to-flux ratios tend to accrete more slowly, allowing matter to accumulate and form dense rings. In some cases, avalanche accretion streams are observed to produce dense rings directly through continuous feeding. We discuss the implications of ring and gap formation driven by winds and streams on grain growth and planet formation.

Snapshots of three simulations. The left, middle and right columns correspond to simulations with a lower diffusivity, a stronger magnetic field, and a higher temperature with respect to the reference model, respectively. The top row shows the mass density (g cm−3) in logarithmically spaced color contours with magnetic field lines in white and velocity (unit) vectors in grey-scale. The middle row shows the radial mass flux per unit polar angle dṀ/dθ = 2πr2 ρvr sinθ where negative (blue) values correspond to infall and positive (red) to outflow. The bottom row shows the ‘face-on’ view of the axisymmetric surface density normalized to its initial distribution for r ≤ 1 au.
Animations of simulations, from top to bottom rows: the reference model, a 4 times lower diffusivity model, a √3 times stronger magnetic field model, and a 4 times higher temperature model, respectively. The left column shows the mass density (g cm−3) in logarithmically spaced color contours with magnetic field lines in white and velocity (unit) vectors in grey-scale. The middle column shows the radial mass flux per unit polar angle where negative (blue) values correspond to infall and positive (red) to outflow. The right column shows the face-on view of the axisymmetric surface density normalized to its initial distribution for r ≤ 1 au.

