

Forbidden neon emission from jets of low-mass young stars can be used to probe the underlying high-energy processes in these systems. We analyze spectra of the jet of DG Tau obtained with the Very Large Telescope/X-Shooter spectrograph in 2010. [Ne III] 3869 is clearly detected in the innermost 3” microjet and the outer knot located at ~6″.5. The velocity structure of the inner microjet can be decomposed into the low-velocity component at ~–70 km s−1 and the high-velocity component (HVC) at ~–180 km s−1. Based on the observed [Ne III] flux and its spatial extent, we suggest the origins of the [Ne III] emission regions and their relation with known X-ray sources along the jet. The flares from the hard X-ray source close to the star may be the main ionization source of the innermost microjet. The fainter soft X-ray source at 0″.2 from the star may provide sufficient heating to help to sustain the ionization fraction against recombination in the flow. The outer knot may be reionized by shocks faster than 100 km s−1 such that [Ne III] emission reappears and the soft X-ray emission at 5″.5 is produced. Velocity decomposition of the archival Hubble Space Telescope spectra obtained in 1999 shows that the HVC had been faster, with a velocity centroid of ~–260 km s−1. Such a decrease in velocity may potentially be explained by the expansion of the stellar magnetosphere, changing the truncation radius and thus the launching speed of the jet. The energy released by magnetic reconnections during relaxation of the transition can heat the gas up to several tens of megakelvin and provide the explanation for on-source keV X-ray flares that ionize the neon microjet.
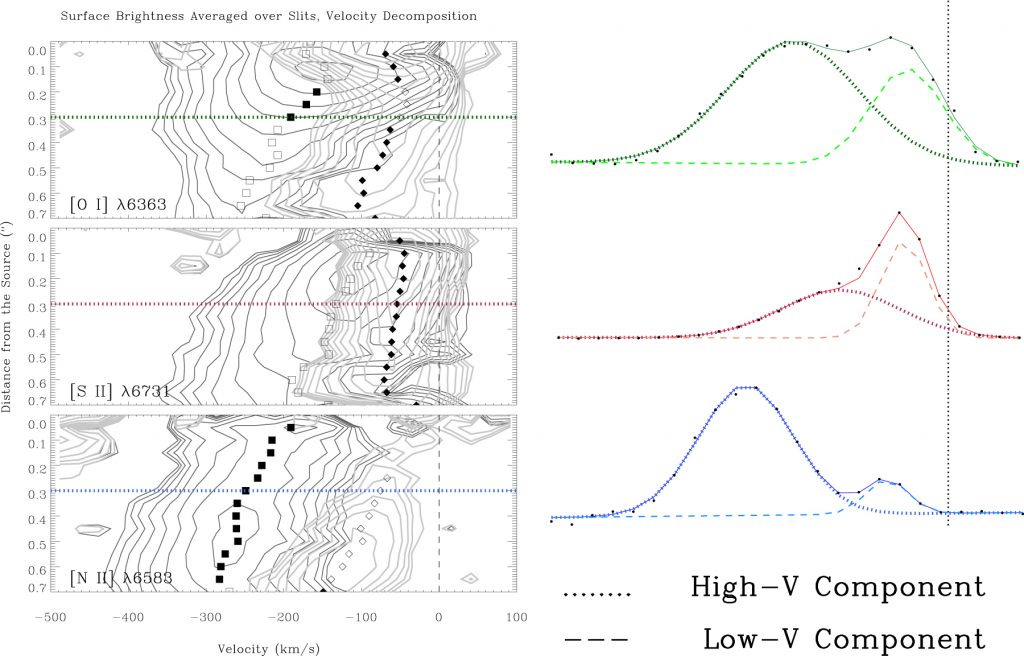
HST/STIS spectra of optical forbidden emission lines
The inner 0″.7 position-velocity diagrams made by averaging the HST/STIS spectra from seven slit positions, showing those of [O I], [S II], and [N II] emission lines, from top to bottom. The line profiles are decomposed into a higher (black contours) and a lower (gray contours) velocity component with two Gaussians. The right panels show the observed line profiles (discrete points) and the two-Gaussian fits at a position of 0″.3 to illustrate the concept of velocity decomposition. The overall (summed) line profiles are shown by thin solid lines. The fitted HVC profiles are shown by thick dashed Gaussians and the fitted LVC profile are shown by thin dashed Gaussians. The centroids from two-Gaussian fitting are plotted with squares (the lower velocity Gaussian) and diamonds (the higher velocity Gaussian) on top of the contours in the left panels. The filled symbols show the Gaussian with higher intensity and open symbols the Gaussian with lower intensity. The results indicate the different nature of the three lines, with the [O I] and [S II] lines dominating at low velocity (~200 km s−1) before 0″.7, and the [N II] line peaking at high velocity (~260 km s−1) throughout the flow.
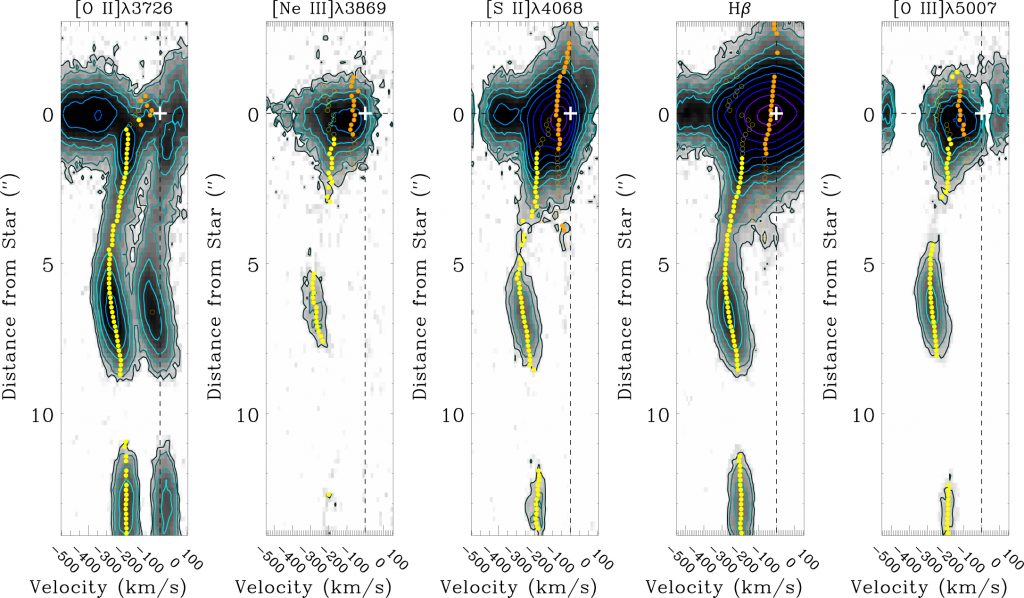
VLT/X-Shooter spectra of optical emission lines
Selected PV diagrams of bright emission lines from the VLT/X-Shooter UVB spectra, showing [O II], [Ne III], [S II], Hβ, and [O III]. The line profiles have been decomposed into high-velocity (yellow) and low-velocity (orange) components. At each position, the fitted velocity centroids of the components are overlaid on the PV diagrams, with the stronger component shown by filled circles and the weaker component by open circles.
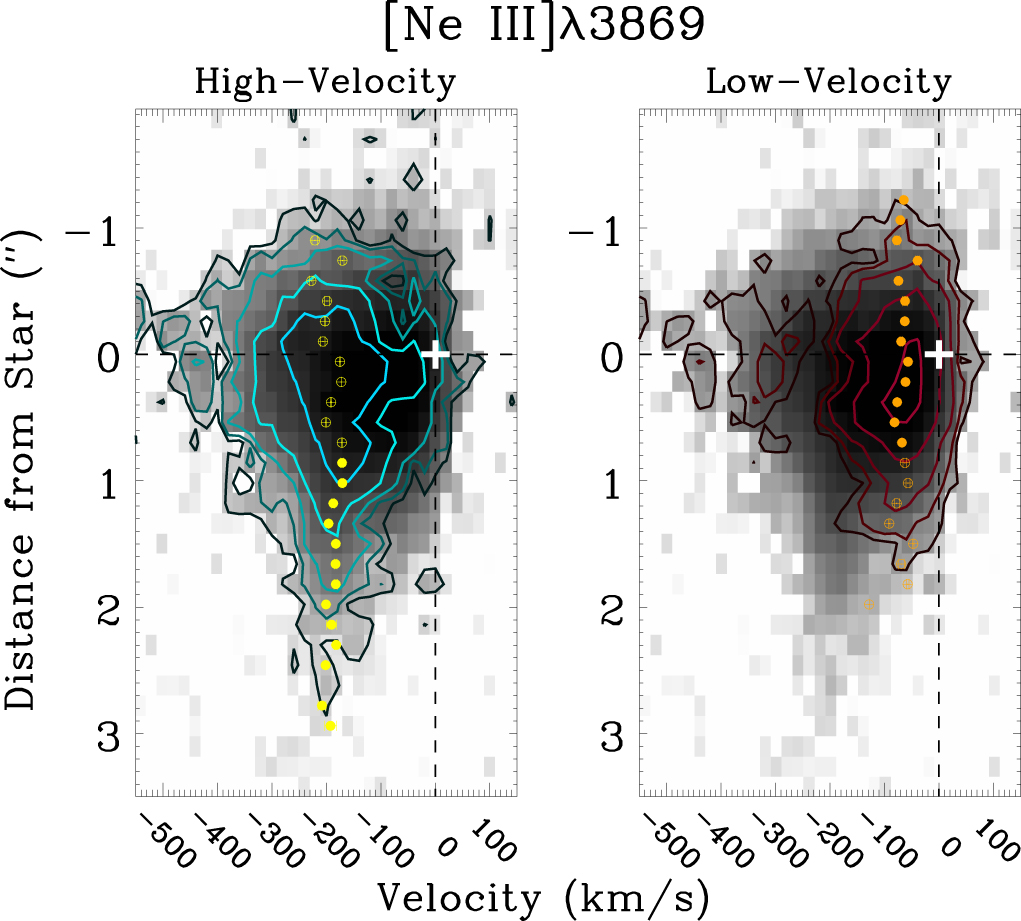
Velocity-decomposed PV diagrams of [Ne III]3869 from the innermost 3” blueshifted microjet
The left and right panels show the HVC and LVC PV diagrams, respectively. Both contours start from 3σ and increase by factors of 2. The background grayscale maps are the original PV diagrams without velocity decompositions. The Gaussian-fitted velocity centroids are overlaid. The filled symbols indicate the stronger component at that spatial position and the open symbols indicate the weaker component.
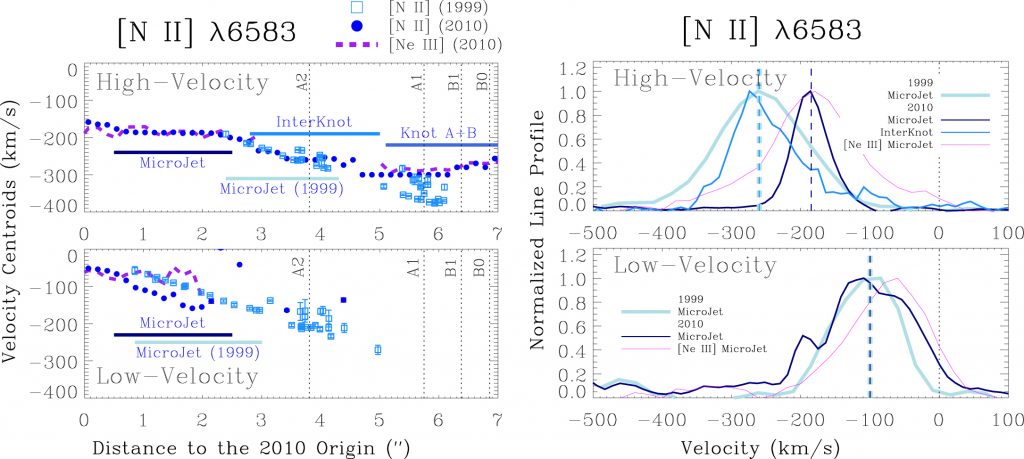
Variations of the [N II]6583 HVC and LVC centroids between the 1999 HST/STIS and 2010 VLT/X-Shooter spectra
The left panels compare spatial variations of the velocity centroids along the jet axis at the two epochs. The origin is set at the 2010 observational epoch, and the 1999 data are shifted to positions according to their respective velocity centroids, adopting the inclination angle (~38) and distance (140 pc). The vertical dashed lines indicate the positions of features in the 1999 spectra, shifted according to their respective velocity centroids. The 1999 (open squares) and 2010 (filled circles) [N II] data are compared against [Ne III]3869 (thick dashed lines) from the 2010 data. The regions of “MicroJet,” “InterKnot,” and “Knot A+B” are defined based on the [Ne III] features, and the “MicroJet (1999)” region is defined by the positions of the shifted 1999 velocity centroids. The right panels compare the normalized line profiles at the two epochs. The light thick lines are the velocity-decomposed profiles of [N II] emission obtained by summing the spectra over the “MicroJet (1999)” region. The strong thin lines are those from the 2010 data; the darker profiles sum over the “MicroJet” region and the lighter profiles sum over the “InterKnot” region. [Ne III] profiles summed over the “MicroJet” region are shown for reference by thin purple lines. The variation of HVC emission may suggest a change of truncation radius of the inner disk and thus magnetic field configuration, which can release X-rays strong enough for neon ionization and emission.