
The molecular outflow from IRAS 04166+2706 was mapped with the Submillimeter Array at a 350 GHz continuum and CO J = 3-2 at an angular resolution of ~1″. The field of view covers the central arcminute, which contains the inner four pairs of knots of the molecular jet. On the channel map, conical structures are clearly present in the low-velocity range (|V – V0| < 10 km s–1), and the highly collimated knots appear in the extremely high velocity range (50 >|V – V0| > 30 km s–1). The higher angular resolution of ~1″ reveals the first blue-shifted knot (B1) that was missing in previous Plateau de Bure Interferometer observation of Santiago-García et al. (2009) at an offset of ~6″ to the northeast of the central source. This identification completes the symmetric sequence of knots in both the blue- and red-shifted lobes of the outflow. The innermost knots R1 and B1 have the highest velocities within the sequence. Although the general features appear to be similar to previous CO J = 2-1 images in Santiago-García et al. (2009), the emission in CO J = 3-2 almost always peaks further away from the central source than that of CO J = 2-1 in the red-shifted lobe of the channel maps. This gives rise to a gradient in the line-ratio map of CO J = 3-2 / J = 2-1 from head to tail within a knot. A large velocity gradient analysis suggests that the differences may reflect a higher gas kinetic temperature at the head. We also explore possible constraints imposed by the non-detection of SiO J = 8-7.
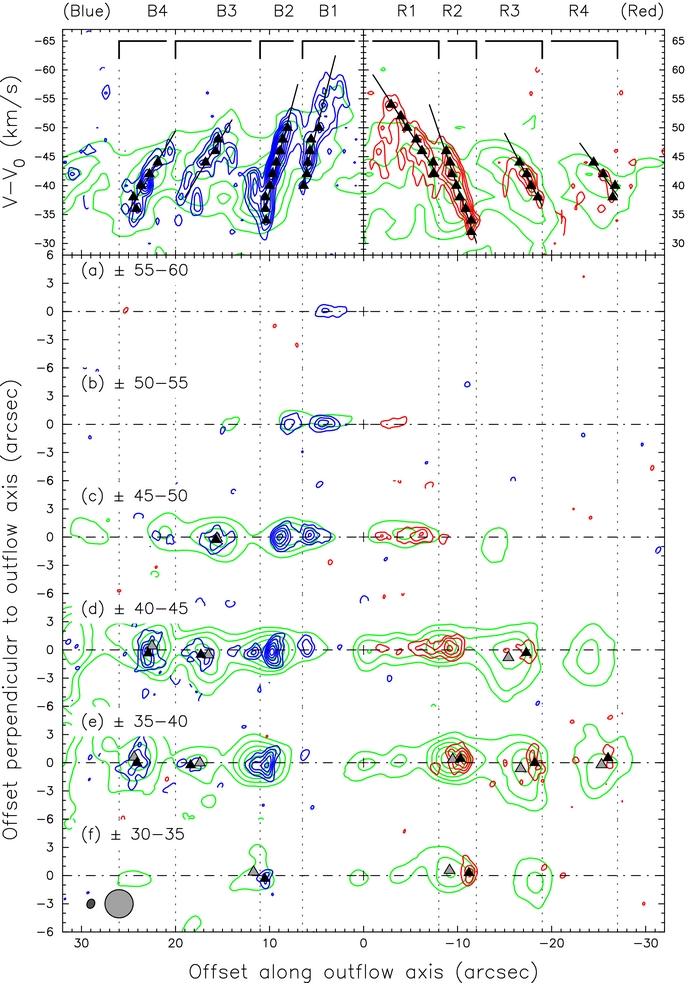
Top: PV diagrams of EHV range is shown. For CO J = 3–2, contour levels are from 3σ in steps of 2σ, where 1σ is 37 mJy per beam. For CO J = 2–1, contour levels are from 3σ in steps of 3σ, where 1σ is 50 mJy per beam. Solid triangles mark the fitted positions and the solid dark lines are the linear fits to them. The vertical dotted lines and the horizontal bars at the top show the division of knot domains based on the velocity pattern. Panels (a)–(f): channel maps of CO J = 3–2 emission (blue/red contours) are overlaid on top of CO J = 2–1 (green contours) with 5 km s−1 velocity bin. The velocities of each channel with respect to systemic velocity are shown on the upper left corner. For CO J = 3–2, contour levels are from 4σ in steps of 3σ, where 1σ is 23 mJy per beam. For CO J = 2–1, contour levels are from 5σ in steps of 3σ, where 1σ is 32 mJy per beam. The beam sizes are shown on the bottom left corner of the whole plot. The dark and gray solid triangles on the maps mark the fitted knot positions of CO J = 3–2 and CO J = 2–1 emission, respectively.
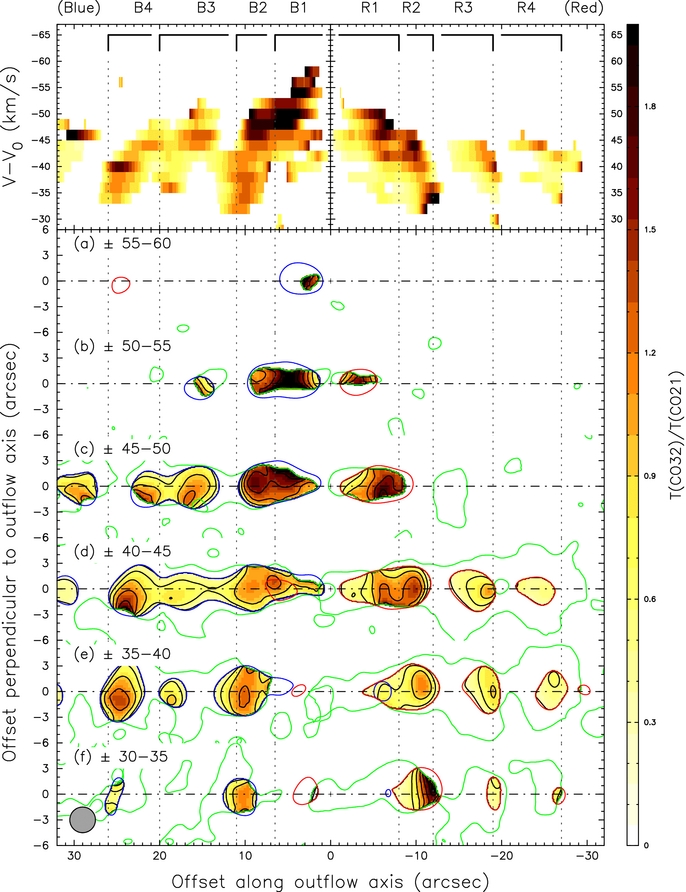
Panels (a)–(f): CO J = 3–2/CO J = 2–1 line-ratio maps (linear color scale and dark contours) are shown with 5 km s−1 velocity bins. Contour levels are from 0.3 in steps of 0.3. The CO J = 3–2 data were smoothed to the same resolution as the CO J = 2–1 data (3″ FWHM) before taking the line ratio. The red/blue contour lines show the 3σ level of CO J = 3–2 data, and the green contour lines show that of CO J = 2–1 data. Line ratios are only calculated at positions where both emission lines are brighter than their respective 3σ levels. Top: line ratios in PV diagram made from data of 2 km s−1 velocity bin are plotted. Note that higher line ratios are found in knots B1 and R1 and at higher velocity in panels (a)–(c). A gradient is found most apparent within R2 and R3 in panels (d)–(f).
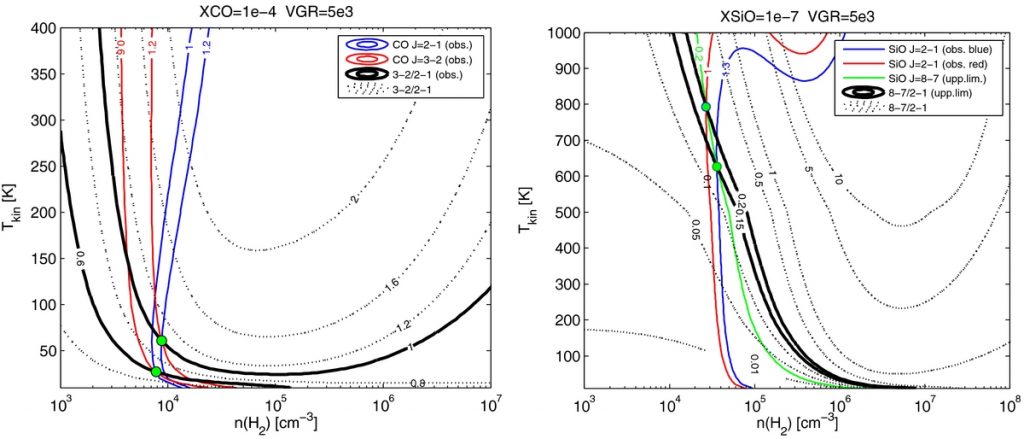
Large velocity gradient (LVG) analysis of CO (left) and SiO emission (right). In the left panel, the dark dotted contours show the general trend of CO J = 3–2 / J = 2–1 line ratio. The contour levels start from 0.4 in increments of 0.4. The thick solid lines show some typical flux values from knots R2 and R3 that we adopted in order to examine the possible head–tail differences in the physical condition of a knot. The corresponding brightness temperatures of CO J = 2–1 and CO J = 3–2 are also shown with red and blue solid lines, respectively. The figure suggest a possible difference in gas kinetic temperature between the head and the tail. In the right panel, the dark dotted contours show the general trend of the SiO J = 8–7 / J = 2–1 line ratio. Contour levels are 0.01, 0.05, 0.1, 0.5, 1, 5, and 10. The thick solid lines show the observed upper limit of line-ratio values set by the SiO J = 2–1 peak emissions (blue/red solid lines) and the nondetection of SiO J = 8–7 in this work (the green solid line). The results suggest an upper limit of gas kinetic temperature of ~700 K. The filled green circles mark the constrained temperature–density condition according to the observations.