

The high-velocity molecular jet driven by Class 0 protostar IRAS 04166+2706 exhibits a unique saw-tooth velocity pattern. It consists of a series of well-aligned symmetric knots with similar averaged speeds, whose speeds at peaks of emission decreases roughly linearly away from the origin. Recent ALMA observations of knots R6 and B6 reveal kinematic behavior with expansion velocity increasing linearly from the axis to the edge. This pattern can be formed by a spherically expanding wind with axial density concentration. In this picture, the diverging velocity profile naturally possesses an increasing expansion velocity away from the axis, resulting in a tooth-like feature on the position–velocity diagram through projection. Such geometric picture predicts a correspondence between the slopes of the teeth and the outflow inclination angles, and the same inclination angle of 52◦ of the IRAS 04166+2706 can generally explain the whole pattern. Aided by numerical simulations in the framework of unified wind model by Shang et al. (2006), the observed velocity pattern can indeed be generated. A proper geometrical distribution of the jet and wind material is essential to the reconstruction the ejection history of the system.
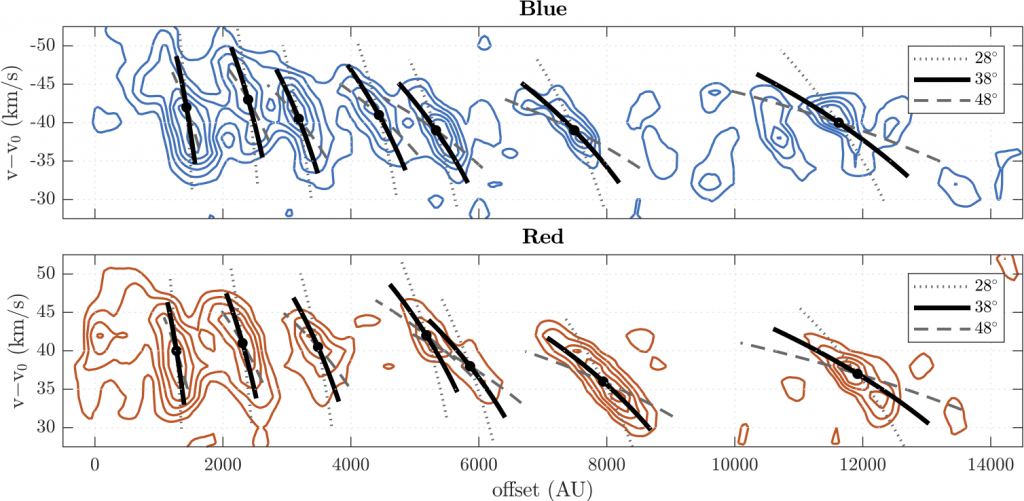
CO J = 2 – 1 Position–Velocity diagram in the extreme-high-velocity (EHV) regime shows the sawtooth-like pattern of the IRAS 04166+2706 jet overlaid by model predictions. The contours start from 0.4 K and the step is 0.25 K. Patterns predicted by the concentrated spherical wind model at three assumed angles from the plane of the sky are shown. The solid lines are results assuming that the outflow axis is 38◦ inclined from the plane of the sky (an inclination angle of 52◦), which fits the overall pattern reasonably. The dotted and dashed lines are predictions assuming 28◦ and 48◦ from the plane of the sky and they deviate more from the observation. Each line segment represents an ejected knot of 7.5◦ half opening angle, and the black dots in the middle mark the center of the knots.
Numerical simulations reproducing the observed velocity pattern of IRAS 04166+2706 assuming different ejection histories.
Upper animation: assuming multiple 20-year long burst occurring on a ~ 93-year period; each observed tooth pattern either results from a single ejecta or multiple collided ones.
Lower animation: assuming a more continuous ejection history of low–high velocity cycle; within each ~ 93-year period, ~ 40 years of higher velocity ejection follows the lower velocity ejection.
A gas kinetic temperature of 100 K is assumed while computing the synthetic line emissions. The upper panels in the animations show the PV diagrams cut along the outflow axis of the blueshifted lobe. The lower panels are the same results after first convolving the datacube with a Gaussian beam of a 420-au full width at half maximum (3′′ at 140 pc).
Related Publications
- Wang L-Y; Shang H; Chiang T-Y, “Ejection History of the IRAS 04166+2706 Molecular Jet”, ApJ: 874, id. 31 (12 pp.), Mar, 2019 [SCI] ( ADS | Fulltext )
- Wang L-Y; Shang H; Krasnopolsky R; Chiang T-Y, “A Two-Temperature Model of Magnetized Protostellar Outflows”, ApJ: 815(1), 39, Dec 10, 2015 [SCI] ( ADS | Fulltext )
- Shang H; Allen A; Li Z-Y; Liu C-F; Chou M-Y; Anderson J, “A Unified Model for Bipolar Outflows from Young Stars”, ApJ: 649(2), 845-855, Oct 1, 2006 [SCI] ( ADS | Fulltext )