Neon emission lines are good indicators of high-excitation regions close to a young stellar system because of their high ionization potentials and large critical densities. We have discovered [Ne III] λ3869 emission from the microjets of Sz 102, a low-mass young star in Lupus III. Spectroastrometric analyses of two-dimensional [Ne III] spectra obtained from archival high-dispersion (R ≈ 33,000) Very Large Telescope/UVES data suggest that the emission consists of two velocity components spatially separated by ~0″3, or a projected distance of ~60 AU. The stronger redshifted component is centered at ~ + 21 km s–1 with a line width of ~140 km s–1, and the weaker blueshifted component at ~ – 90 km s–1 with a line width of ~190 km s–1. The two components trace velocity centroids of the known microjets and show large line widths that extend across the systemic velocity, suggesting their potential origins in wide-angle winds that may eventually collimate into jets. Optical line ratios indicate that the microjets are hot (T < 1.6 × 10⁴ K) and ionized (ne > 5.7 × 104 cm–3). The blueshifted component has ~13% higher temperature and ~46% higher electron density than the redshifted counterpart, forming a system of an asymmetric pair of jets. The detection of the [Ne III] λ3869 line with the distinct velocity profile suggests that the emission originates in flows that may have been strongly ionized by deeply embedded hard X-ray sources, most likely generated by magnetic processes. The discovery of [Ne III] λ3869 emission along with other optical forbidden lines from Sz 102 supports the picture of wide-angle winds surrounding magnetic loops in the close vicinity of the young star. Future high-sensitivity X-ray imaging and high angular-resolution optical spectroscopy may help confirm the picture proposed.

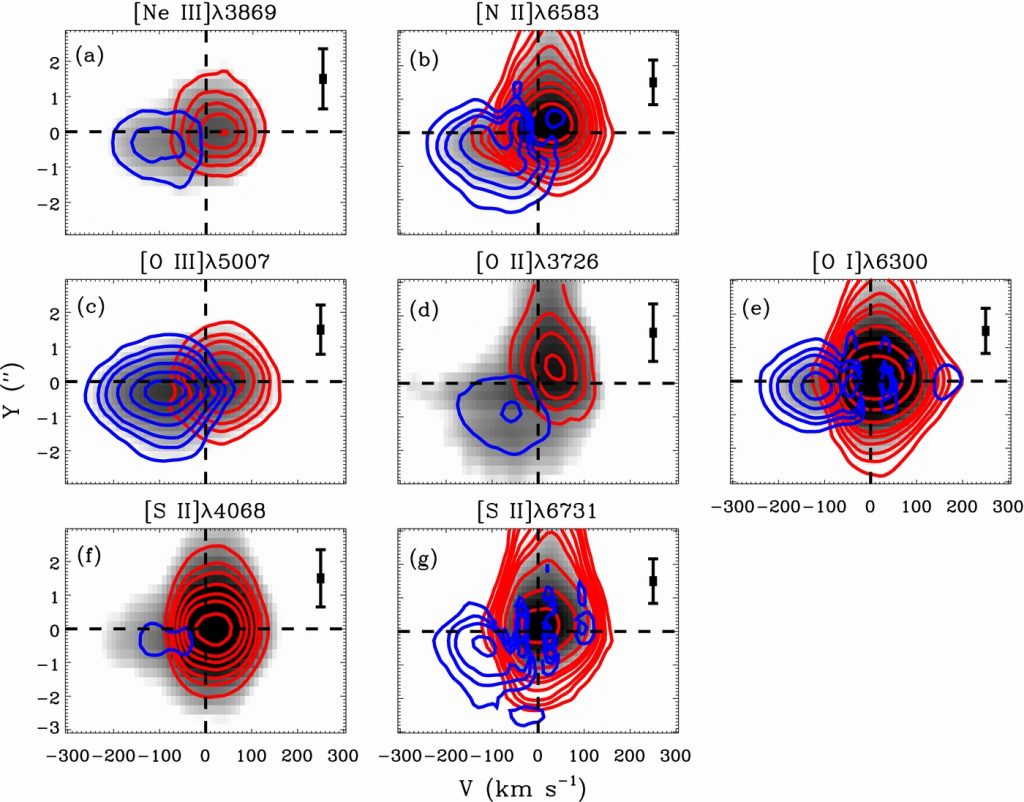
(a)–(g) Position–velocity (PV) diagrams of selected optical forbidden emission lines from Sz 102. All the spectra have been binned every 10 km s−1 and smoothed with Gaussian with σG = 1.0 pixel. The velocities are relative to the systemic value. The positions are along the position angle of ~109° and are relative to the fitted positions of point-spread functions at each wavelength. Shown in gray scales are spectra directly extracted from the data, and shown in blue and red contours are decoupled spectra after velocity decomposition using multiple Gaussian fitting.

Decomposed [Ne III] λ3869 line profiles normalized to the redshifted peak intensity. The spectra have been binned every 10 km s−1 in the spectral direction. The blueshifted and redshifted emissions are shown as blue and red histograms, respectively. For each decomposed line profile, a single Gaussian is fitted and is shown as blue and red thick lines, respectively. The fitted peak position and FWHM for the blueshifted emission are −91 ± 3 km s−1 and 196 ± 9 km s−1 and for the redshifted emission are +21 ± 1 km s−1 and 135 ± 2 km s−1.

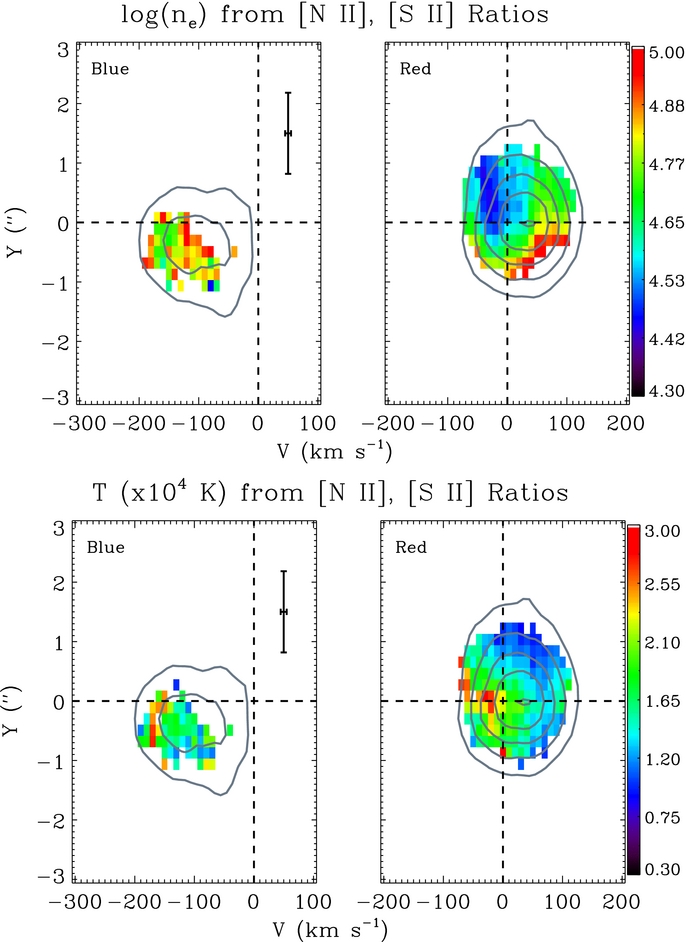
Derived electron densities (ne, in logarithmic scales with units of cm−3) and temperatures (T, in linear scales with units of 104 K) derived from [S II] λλ4068/6731 and [N II] λλ5755/(6548 + 6583) ratios. The values in each pixel are obtained by matching the two ratios in the (ne, T) plane. The blueshifted jet is shown in the left panel, and the redshifted jet is shown in the right panel. Velocity-decomposed [Ne III] λ3869 are plotted as gray contours. Without the corrections for extinction, the median and 1σ standard deviation of the values for each jet are as follows: the electron density is 6.7 ± 2.2 × 104 cm−3 and a temperature of 1.7 ± 0.6 × 10⁴ K for the blueshifted jet, and the redshifted jet has an electron density of 4.6 ± 2.4 × 104 cm−3 and a temperature of 1.5 ± 0.5 × 10⁴ K. These values suggest that the blueshifted jet has on average ~46% higher electron density and ~13% higher temperature than the redshifted jet, although large scatters are present in the inferred values.

